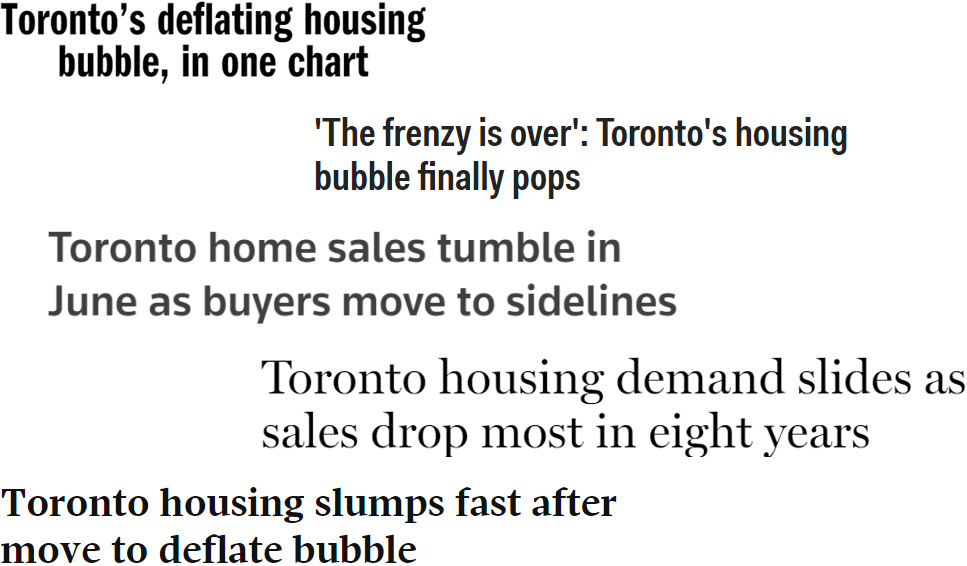
Following the latest release of figures from the Toronto Real Estate Board (TREB) last Thursday, there have been a variety of headlines proclaiming the bursting of the real estate bubble in the Greater Toronto Area.

But has that really happened? And is there a real estate bubble at all? We took a deep look at the real estate numbers over the last ten years to try to answer all your questions about the state of real estate in Toronto and the GTA.
On the face of it, some of the numbers released in the last few months seemed quite alarming. From a high of $920,791 in April, the average selling price of homes in the GTA decreased quite sharply to $793,915 in June – a 13.8% drop. Similarly, the number of sales notably dropped (reaching the lowest figure in the month of June in over 10 years) and the number of new and active listings rose dramatically.
Understandably, this made a lot of people take notice and start wondering if major changes are taking place. A large number of dramatic headlines announcing the bursting of the Toronto real estate bubble also helped fan the flames of concern. But are the real estate bears finally right and are these signs that the Toronto housing market has turned?
While some of the month-on-month changes may look quite dramatic, they are not the best indicators of where the market finds itself. Monthly numbers can be affected by a great number of variables (for example, the weather, a short-term increase in purchases of a particular type of property, different buying patterns based on the season, local changes and major news) and two months is not enough time to determine a trend. To get a better picture of what is going on, we looked through every monthly release by TREB over the last ten years. It was time well spent because we think it will prove invaluable in helping understand the real estate market in Toronto.
Average Home Prices in the Greater Toronto Area
A couple of things stand out when you look at the numbers. Firstly, they help illustrate the point above about month-on-month changes. As the statistics show, even when the market rises, there are ups and downs along the way. In fact, one of the biggest single month drops came in December 2016 (5.9%) – immediately prior to the three hottest months ever in Toronto Real Estate.
The most noticeable changes in the numbers are the surges in prices at the beginning of 2016 and 2017. Until that point, the growth in prices had been reasonably steady, but there is a noticeable increase from January 2016 to May 2016 (when the average selling price rose from $631,092 to $751,908 – a 19.1% increase) and from December 2016 to April 2017 (when the average price rose from $730,472 to $920,791 – a 26.1% increase). Whether you call it a real estate bubble or just a red-hot market, it is clear that there was a different dynamic in these periods. But what was the cause?
One obvious reason for the increase in prices is that buyers can afford more. Historically low interest rates over the last eight years have increased the amounts that people can borrow and that, in turn, has increased their spending power when buying homes. That gives people the means to enter the market but doesn’t necessarily cause prices to rise. For that you need competition and the statistics for active listings reveal quite a lot here.
Another point that is often overlooked is that these numbers refer only to resales, so don’t paint a full picture of real estate in Ontario. The Building Industry and Land Development Association (BILD) provides statistics for new home sales and its latest report, released June 23, stated: “In May, the average price of available new low-rise single-family homes was $1,222,699, an increase of about $10,000 from April and a 40 percent increase from a year ago”. This was based on 3,902 new homes sales so, on the surface, it seems that demand is still high for new homes, with prices increasing as a result.
Active Listings in Greater Toronto Area Real Estate
There are peaks and troughs throughout this data, which reflects the nature of real estate. The market is generally quieter in the winter and busier in the summer, so it is unsurprising that we have so many ups and downs. However, a pattern emerges, with the peaks and troughs getting lower as time moves on. This reached a nadir in December 2016 when there were just 4,746 active listings – an all-time low – and it continued over the next three months, which were the lowest in terms of active listings over the ten years we analysed (January – 5,034; February – 5,400; March – 7,865). Demand remained high during this time, so there was a huge amount of competition for the limited listings and that led to intense bidding wars on many properties – resulting in a surge in sale prices or what some people referred to as a real estate bubble.
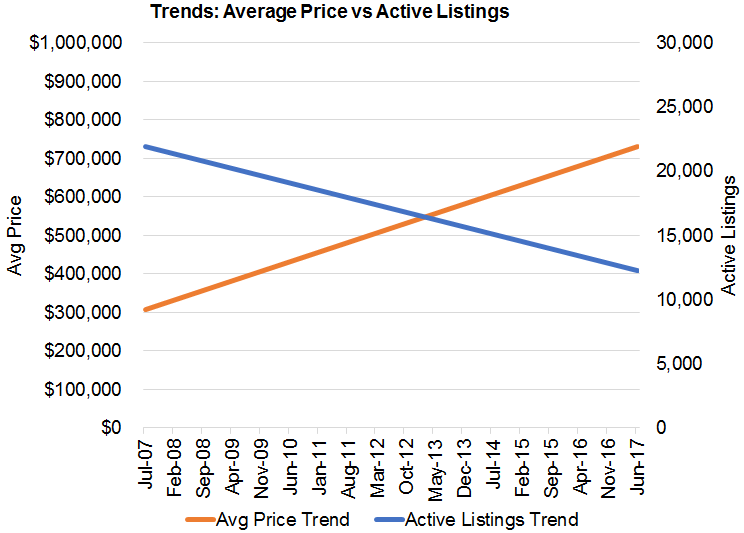
The effect reduced listings have had on prices is perhaps best illustrated in the following chart, which shows the trends of both sets of numbers and the apparent correlation between them:

Since the beginning of May, there has been a resurgence in the number of active listings, with some encouraging increases over the last two months. This is a positive for the market as it means more supply but, although the increase may seem quite dramatic, it should be noted that the big rise is only relative to the scarcity of listings earlier in the year and during 2016. When you look at the average over several years, the number of listings appears to be returning back to normal levels.
There have been a number of articles recently with anecdotes suggesting that the bidding wars have disappeared and this increase in supply would certainly be a major factor in that. However, they have not gone completely and it seems that there is still great competition for homes in high-demand areas, with some homes selling for way over asking.
Number of Home Sales in the GTA
At first glance, there doesn’t seem to be anything unusual in these numbers The number of sales goes up in the summer and down in the winter. It’s a standard pattern that has been repeated throughout the years. However, there is a noticeable change in 2017: the peak arrived sooner. In previous years, sales numbers have jumped in March, grown to a peak in May and June, dropped a little over the next few months, and then returned to winter levels in December.
On this occasion, the peak came in April and then slumped in June. The 7,974 sales recorded last month represented a 37.3% drop from June 2016 and was the lowest number for the month of June since 2002. Some people have found the drop quite alarming at a time when the Ontario real estate market is usually at full speed and it certainly suggests a change in buyer mentality, which is another factor in the reduction of bidding wars.
Two months data is difficult to call a trend. It could be a case of buyers waiting to see the effects of the 16-point Housing Plan and wary about headlines proclaiming a downturn in prices. It could equally be a more permanent shift and will reflect a new reality in Toronto real estate, with fewer sales helping to boost inventory that recently fell to its lowest level in the six years of data we could find.
The Fundamentals
A common argument put forward suggesting that there is a real estate bubble in Toronto is that the price of homes does not match the “fundamentals”. In short, this means that the average cost of a home is beyond the means of a family with an average income. This is true and the issue of affordable housing is certainly something that needs to be addressed.
This fact has also led to accusations that the main driver of increases in house prices has been foreign investment. Countless articles discussed the issue and the foreign buyer tax was the highlight feature of Ontario’s Fair Housing Plan. Thanks to that plan, we now have access to information on foreign investment as buyers are now required to confirm if they are Canadian citizens or permanent residents. As it turns out, the first release of figures showed that only 4.7% of homes sold were bought by foreign buyers between April 24 and May 26. That suggests that foreign buyers are probably not the primary fuel behind rising prices, although they may be more of an issue in certain areas of the GTA, with a recent Globe and Mail report suggesting 9.1% of York Region home sales involved foreign buyers.
In fact, the truth seems to be that prices are actually affordable for many people. A recent analysis by Better Dwelling suggested that, in 2016, there were 264,110 families in Toronto that earned enough money to afford a mortgage on a $1 million+ home. Based on the sales figures for that year, the report estimated that only 7.3% of these families would need to buy homes to support current prices. It’s not a pleasant truth for many people who find that prices in the housing market are out of their reach, but it is an unavoidable fact that Toronto homes are well within the means of many people who live there.
An important footnote is that the situation could change with a rise in interest rates. The Bank of Canada announced a quarter percentage point rate increase Wednesday – the first time the bank has raised the key interest rate in seven years. The increase to 0.75% probably won’t make a significant impact on many people’s mortgage payments – as the majority of mortgages taken out are for fixed rate terms – but changes could affect a buyer mentality that is already shaken, especially with suggestions that further increases may follow later in the year. At the moment, interest rates remain historically low but further increases could affect affordability both for existing homeowners looking to re-finance and new buyers entering the market, so many people will be watching the rates carefully.
Real Estate in the Greater Toronto Area
What can we conclude from all these numbers? Changes seem to be happening in the GTA real estate market but they may not be as dramatic as they first appear. For a long time, this has been a seller’s market, with limited supply and high demand causing prices to rise quickly. We are shifting to a more balanced market, with increased supply helping to reduce some of the demand and giving buyers some time to pause and be more selective – in turn, requiring sellers to re-evaluate the price they can demand.
For now, the Toronto real estate market seems relatively healthy. There has been a slight pull back after the record-breaking start to the year, but year-on-year prices are still up (a 6.3% increase recorded in June 2017) and demand seems high. However, it is important to keep a close eye on the market over the next few months to see if any of the short-term changes become trends or whether the market starts to rebound – as happened in Vancouver after government measures contributed to a temporary slowdown in the growth of prices in late 2016.


