
As the second wave of the covid-19 pandemic starts to create more restrictions for the public, we take a look at how the first eight months of the pandemic affected Greater Toronto Area real estate – for good and bad.
When the covid-19 pandemic arrived, it seemed obvious that it would have a major effect on real estate. The market had been heating up in the first few months of the year, with bidding wars becoming a common occurrence again. However, the strict early lockdown that began in March brought a halt to most economic activity in the country and stopped real estate in its tracks.
After recording 19,849 home sales in the first three months of the year, the Toronto Regional Real Estate Board (TRREB) reported just 2,975 sales in April and 4,606 in May. We have reviewed TRREB reports going back to July 2007 and that March total was the third lowest number of sales recorded in the GTA in that time and 4,817 less than the previous lowest total ever recorded in the month of April.
It was quite a shock to the real estate market during the spring period that is traditionally one of the busiest times for real estate. Buyers and sellers were held back by concerns of the virus, job losses appeared to reduce the potential buyer pool, and an unclear outlook left many wondering what would happen next.
Some were predicting that the pandemic would have a monumental impact on real estate. Famously, on May 19th, CMHC President and CEO Evan Siddal said that CMHC was forecasting a “decline in average house prices of 9 – 18 per cent in the coming 12 months.” It seemed like a dramatic statement at the time considering the heated market in the first three months of 2020, but it wasn’t beyond the realms of possibility.
However, in the six months since that prediction was made, the average price of a home in the GTA has risen from $863,599 to $968,318 – a 12.1% increase that is probably greater than even the most fervent real estate bulls would have predicted. For the CMHC prediction to come true, the average price would now have to drop to between $708,151 (a 26.9% decline) and $785,875 (an 18.8% decline) in the next six months and the chances of that happening are extremely slim.
So, what happened? Why were the CMHC so wrong and how did the market behave?
Spring into Summer
The first and perhaps easiest observation to make is that the spring market didn’t just disappear; it was simply postponed to a later date. Traditionally, the period from April to June is the busiest in terms of real estate sales in the GTA, with each month usually recording over 10,000 sales. The lockdown prevented that activity in spring 2020 but it didn’t reduce demand, so as soon as restrictions began to ease, buyers flooded back into the market.
Sales figures in June were slightly below average levels for that month but the market really started to pick up after that. In July, 11,081 homes were sold – setting a record for that month and easily surpassing the average number of sales in July from the previous 10 years (8,114). It was a similar story in August, September and October. 10,775, 11,083 and 10,563 sales were recorded in those three months, setting records for the most sales ever in those months and far outstripping the 10-year averages (7,408, 7,407, and 7,944).
What was notable during this period is that, while sales activity roared back to life, listings increased but at a reduced rate. Active listings – defined as the number of available listings at the end of each month – were on a downward trend before the pandemic and this continued until May. Even when the active listing numbers began to pick up, they remained down in year-over-year comparisons until August. This meant that sales were growing at a faster rate than inventory
It is unclear why listings were slower to recover than sales. Perhaps it was a result of the pandemic, with people less keen on inviting multiple strangers into their homes for showings. Maybe low interest rates encouraged people to hold onto their properties and use the equity in their homes to add to their portfolios. Perhaps it was connected more to the types of properties in demand, which we will look at shortly.
Regardless of the reasons, there was an inevitable consequence of supply failing to keep up with demand. With more competition for listings, bidding wars became more common and prices began to rise – leading to the 21.1% increase in six months mentioned earlier in this article.
A New Look
While the supply-demand dynamic has changed the overall outlook of the market, things look a little different when we focus on locations and property types.
When looking at the share of total sales taken up by different property types, a notable pattern appears. In the 12 months from May 2019 to April 2020, detached homes accounted for 46.5% of sales. In the next six months, they accounted for 50.3%.
In fact, June, July, August and September all saw detached homes account for over 50% of sales – a level that hadn’t been reached since May 2016. At the same time, condo apartments accounted for a much lower share of sales than usual. They dropped from an average of 26.2% (during the period from May 2019 to April 2020) to 21.4% over the last six months. Semi-detached homes and townhomes saw only slight increases in the share of sales during the same periods (9.4% to 9.9% and 9.1% to 9.7%).
This highlights a shifting attitude in the market, with a decline in interest in condo apartments and an increase in demand for detached homes. The year-over-year sales numbers highlight this as well, with the number of detached home sales up 32.9% in October, while condo apartments were only up 1.9%. As you would expect, this has also caused a steeper increase in average prices for detached homes (14.8% year-over-year increase in October 2020), although condo apartments did still make decent gains (7.1% year-over-year increase).
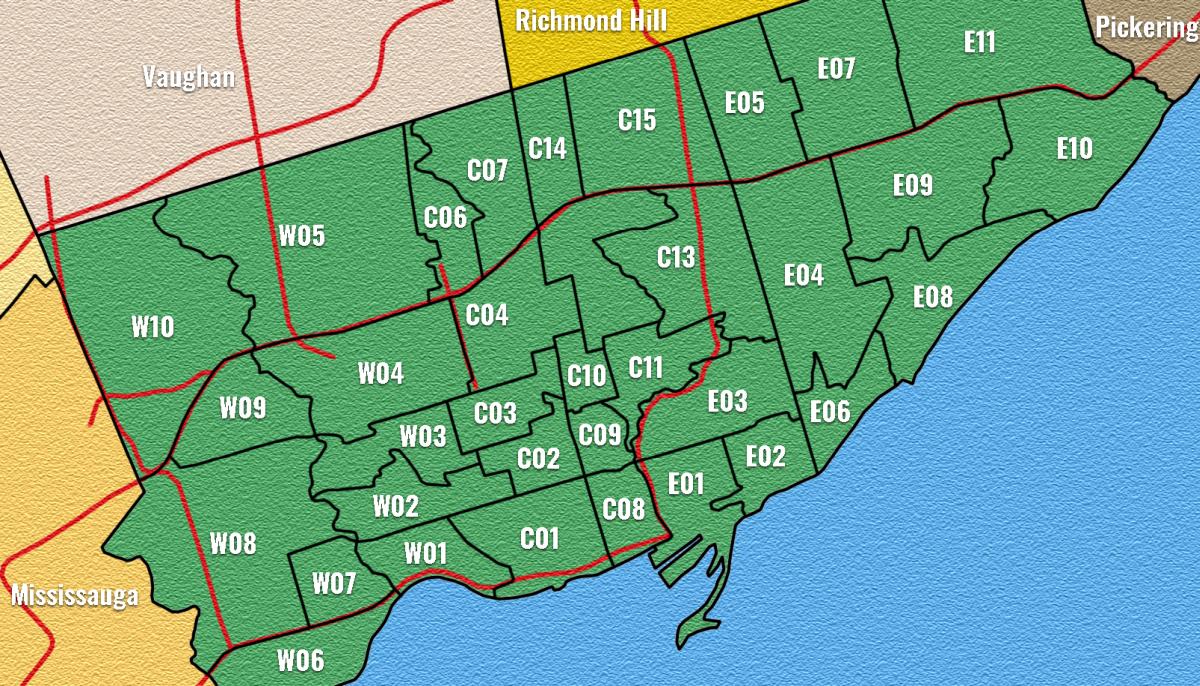
A trend also seems to appear when focusing on the locations of home sales. Looking at the October year-over-year sales numbers, Durham Region (42.3%), Halton Region (48.9%), Peel Region (34%), and York Region (36.2%) all saw big increases in sales, while the City of Toronto only rose 6.6%. Focusing more closely at Toronto, the TRREB data splits the city into three regions – west, central and east – and these had notably different results. While Toronto West (15.2%) and Toronto East (10.6%) saw year-over-year increases in sales, Toronto Central saw a 0.8% decrease. This was mostly caused by three specific TRREB-defined areas: Toronto C01, Toronto C14 and Toronto C15 (see locations in the map below). These three areas have some of the highest concentrations of high-rise condominiums in the city, so it is another indication that buyers are focusing more on low-rise homes.
At the same time, there are municipalities and areas of Toronto that have seen huge increases in the number of sales. In total, 27 locations saw sales climb by more than 25% year-over-year in October. All of these locations are suburban areas where single-family homes account for the largest share of homes.
In terms of average prices, in the October 2020 TRREB report, there were only five locations that saw year-over-year decreases and all of these were in Toronto (C08, C11, C12, E03 and E06). Of the remaining 63 locations, six saw average prices increase by less than 5%, 11 were between 5% and 10%, 25 had increases between 10% and 20%, and 21 saw average prices increase by more than 20% year-over-year. The biggest increases were observed in Adjala-Tosorontio (59.3%), Uxbridge (42.5%) and Scugog (36.9%).
What do these local numbers and house type statistics mean? Well. They appear to be describing a widely-reported narrative of people moving away from condos and the more densely populated areas. Some people appear to be moving to more suburban parts of Toronto itself, while others are using the equity they have built up to buy larger homes farther away, creating demand and pushing up prices in areas that have generally not seen as much demand.
What is driving this change? We can only speculate about individual circumstances but it is clear that covid-19 is a major contributor, as the data changes occurred during the pandemic. For individual buyers and sellers, the reasons may differ and we can get some idea from anecdotal reports.
A change in focus from condos to detached homes seems likely to be a direct result of the pandemic and, particularly, the subsequent lockdowns. It is more appealing to be locked down in a spacious home with a backyard than in a high-rise condo unit with limited or no outdoor space. Similarly, the restrictions placed because of the virus may have made condo living less appealing for some as it has possibly meant reduced numbers in elevators, closures of shared amenities, or the likelihood of coming into contact with more people at a time when social distancing is recommended.
That probably isn’t the only reason we are seeing a reduction in condo sales. The market for long and short-term rentals has slowed because of students and employees working remotely, reduced numbers of overseas students, and a huge drop in Airbnb bookings because of both the pandemic and changes in city regulations. With rental income removed, it seems likely that some people have chosen to cash in on their assets, while investors have been more reluctant to buy.
In terms of locations, it has been suggested that many people are taking advantage of their new remote working conditions and moving to places farther afield where they can enjoy a different quality of life. This will certainly be true for some people but the increase in sales on the periphery of the GTA may also be a simple case of market dynamics. Homes in those areas are cheaper and it may be that people are moving to locations where they can afford the kind of detached property they are looking for, rather than searching for a specific lifestyle.
Will these market conditions remain or will we see things revert to the norm? For the time being, there is no reason that it will change. We are in the midst of a second wave and, while there has been positive news regarding vaccinations, it will take some time before widespread vaccination is completed. Until such a time, and with lockdowns and restrictions starting and stopping, we are likely to see a similar outlook amongst buyers.
Once life begins to return to normal, a lot will depend on what the new normal looks like. Some of those people who moved farther away will have to start commuting and will need to make tough decisions about whether the lifestyle is worth the trade-off of a long commute. It seems likely that some will return to the city, so it is entirely possible that we will see a reversal or partial-reversal of the covid-19 real estate trend. Only time will tell.


Really insightful article!